Ready to continue your holiday momentum? Contact us today to learn more about accelerating your performance marketing campaigns.
Insights
Cyber Week 2022 Recap
This year’s Cyber Week 2022 was predicted to be a fluctuating shopping season, but many retailers still met, or exceeded, last year’s numbers. Overall, among the top categories on the Rakuten Advertising Network, the sales for home goods, luxury, jewelry, and travel ranked the highest for this season.

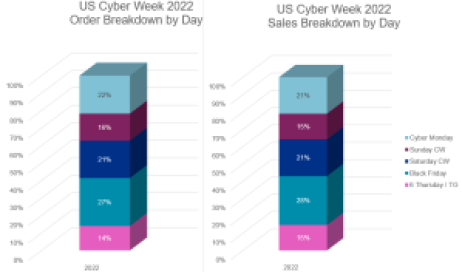
According to figures from Adobe Analytics, which tracks seasonal e-commerce activity, Cyber Monday alone pulled in $11.3 billion in sales online, up 5.8% YOY. Cyber Monday has typically been the largest day of the “Cyber 5” shopping days, but Thanksgiving saw $5.29 billion in sales and Black Friday had $9.12 billion in sales — both days also up from earlier forecasts. The Saturday and Sunday dates had $9.55 billion in sales. Our analysis below represents the US Rakuten Advertising network data from same-store purchases, comparing 2021 and 2022.
US Overall Trends
Rakuten’s Affiliate Network, once again showed that the largest shopping day is Black Friday. It not only had the most sales, but it also had the largest number of clicks, orders, and the highest conversion rate above 7% for this year. This is partly because our network is comprised of many large retailers with brick-and-mortar stores that focus on running heavy promotions for increasing both in-store and online purchases on Black Friday.
Starting November 15th, we posted live click data showing how certain retail categories were trending and progressing in 2022 vs. 2021. Before Cyber Week began, we saw that US shoppers were not as active online as in 2021, as many shoppers were excited to return to in-store shopping. We also saw that some 2021 shopping patterns were repeating, and there was not a significant shift in buying earlier in the week or the month of November.
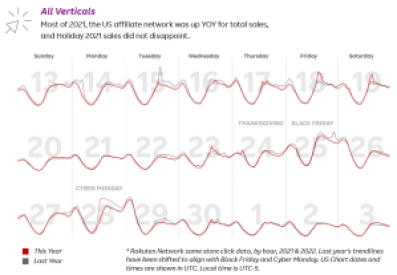
This is a sign that shoppers were more intentional about purchasing in 2022 and that supply chain issues did not seem to be a concern.
Despite clicks being down, we saw sales increase YoY for certain days. Black Friday increased 1% over last year and had the highest conversion rate, above 7%. The following Saturday sales increased 10% YOY and also had a conversion rate above 7%. Thanksgiving Day, once again won for having the highest AOV of the weekend, this is partially due to the tendencies of shoppers to use Thanksgiving as their day to shop for bigger ticket items such as, TVs, Computers, gaming systems. Giving Tuesday was also up 6%. Overall, Cyber 5 had increased sales YOY by 3%, orders and clicks decreased, AOV increased partly due to inflation.
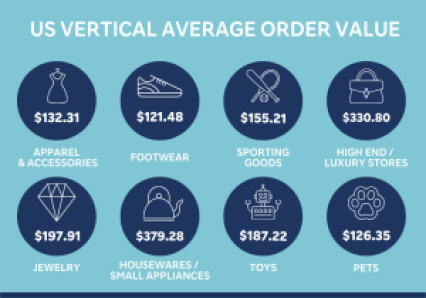
Key Verticals
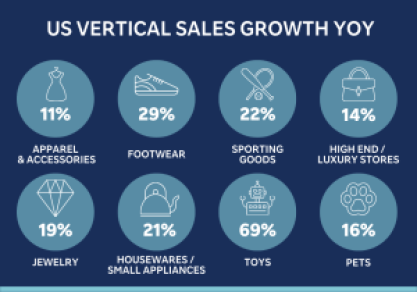
Many categories were up YOY, including apparel, sporting goods, jewelry and luxury items.
These key categories increased this year:
- Apparel & Accessories: This category saw a 7% click growth, 2% order growth, 10% sales growth, and a conversion rate of 6.80%.
- Footwear: This was one of the strongest categories with a 25% click growth, 25% order growth, 28% sales growth, and a conversion rate of 6%.
- Sporting Goods: This category held strong into 2022 with an 8% order growth, 22% sales growth, and a 9.04% conversion rate.
- High End & Luxury Stores: This category continues to thrive despite inflation and other economic influences. High end and luxury stores saw an 8% increase in clicks, 8% order growth, 9% sales growth, and a 4.9% conversion rate.
- Jewelry: This is another category that continues to perform well YoY. Jewelry saw a 10% click growth, 40% order growth, 19% sales growth, and a conversion rate of8.48%.
- Housewares & Small Appliances: This category performed very well with a 6% growth in clicks, 22% order growth, 21% sales growth, and a conversion rate of 5%.
- Toys: This category historically performs well this time of year, and 2022 was no different. Toys saw a 56% increase in clicks, 87% order growth, 69% sales growt
 h, and a 4% conversion rate.
 - Pets: Pet products had a strong showing with 5% click growth, 3% order growth, 16% sales growth, and a conversion rate of 7.8%.
Another bright spot was travel. Clicks for travel were up 31% over 2021 totals during the Cyber 5, and on “Travel Tuesday” we saw clicks increase 33% over last year. This is a great sign for things to come, and that travel will be strong in 2023 since the YOY growth is promising.
Key Publishers
The top publisher types saw some major changes. Content and Subnetwork publishers (including influencers) which saw high growth during the pandemic were able to sustain their market share of traffic leading into Cyber Week. This category of publishers may not have exceeded 2021 levels on Black Friday and Cyber Monday, but leading into the holiday, they were visited more often.
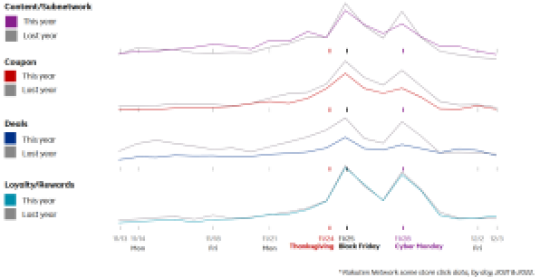 Coupon sites, which were expected to do better in 2022 because shoppers would be hunting for deals (from inflationary cost adjustments) surprisingly saw less traffic, but Loyalty sites did not see much change YoY. Loyalty sites were able to keep their traffic level, and hold market share by offering coupons, deals, editorials and or product reviews on top of their rewards for shopping.
Deal sites, who typically see high traffic volume leading into Thanksgiving, decreased slightly.
Given the impact on e-commerce that the previous two years have had, the growth for this year’s Cyber Week reflects performance for the affiliate marketing channel. Our network of publishers and partners continues to shine during this holiday season, proving that Black Friday remains at the top, shoppers will continue to hunt for promotions even earlier, and sales have increased despite lower overall click volume.
Related Posts

April 25, 2024
Insights US Report: The Year of the Empowered Financial Consumer
Explore key findings from our 2024 consumer finance survey of 15,000 US consumers on financial behaviors, highlighting the impact of FinFluencers, how and where consumers are looking for their next financial service, and strategic affiliate marketing insights that will bring financial brands to the forefront of consumer minds.

January 4, 2024
Insights Publisher Spotlight: Skimlinks
Skimlinks, a Taboola company, is the leading commerce content solution provider for publishers and advertisers. Read our latest spotlight and hear first-hand how Skimlinks is helping brands optimize the conversion journey to deliver outstanding results for brands.

December 18, 2023
Insights The Always-On Luxury Shopper: Affiliate Marketing Strategies
The luxury shopping market continues to remain a key retail focal point despite economic headwinds. Our latest blog analyzes the luxury shopper, explores specific luxury shopping destinations, and provides tips and tricks on how best to leverage different affiliate marketing strategies to reach your ideal luxury consumer. Read the entire blog now to learn more!